Cover photograph by Sedat Taşkan on Pexels.
← Insights & ArticlesA server, a container, a volume and a scheduler. What each one is for, and what it costs.
Sep 13, 2026 · 12 min read
Most AI work I see stops at the same place. There is a notebook, or a script, and it does something genuinely clever, and it runs when a person runs it. Then it goes in a repository and nothing happens to it again.
The reason is not that the next step is hard. It is that the next step is unfamiliar, and it is made of four unglamorous pieces that nobody writes about because none of them is interesting on its own.
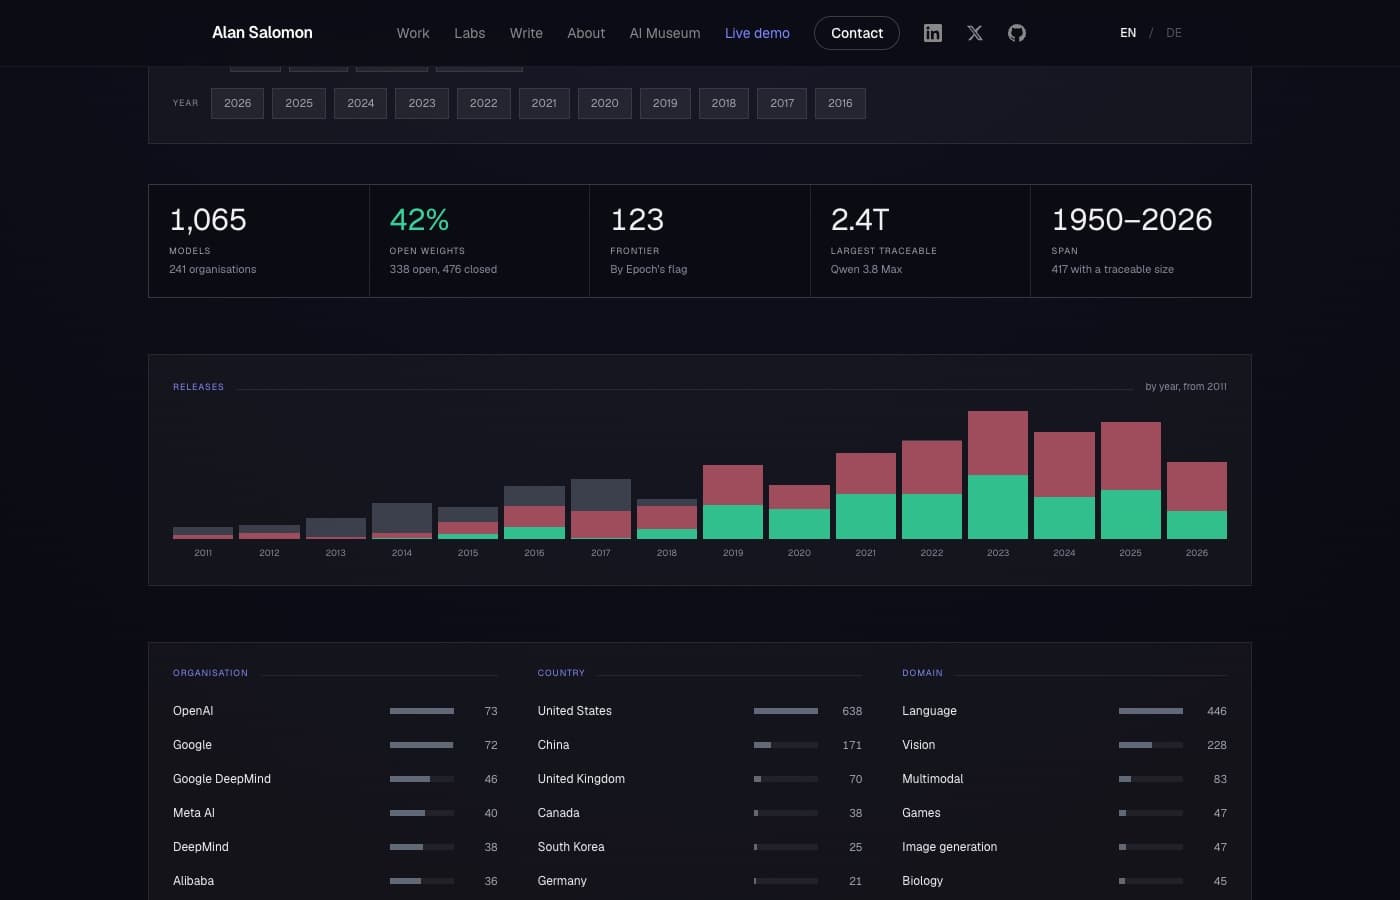
This is an account of moving one small thing across that gap: a script that counts facts about AI models, which now runs on a server every morning at 06:17 and publishes what it found, whether or not I am awake. It took an afternoon. The parts worth writing down are the decisions, because most of them have an obvious-looking option that fails quietly.
Production is an overloaded word that usually means whatever the speaker wants it to mean. For something this size it has three concrete properties, and a demo has none of them.
Those three map almost exactly onto four pieces of infrastructure, which is why this list is short and why it does not need Kubernetes.
runs without you   ->  a scheduler
survives           ->  a server, and a volume
                       (a container, so it can be rebuilt)
says when wrong -> the application itselfA machine in Falkenstein: four virtual cores, eight gigabytes of memory, eighty gigabytes of disk. Ten euros and sixty-nine cents a month including backups and an IPv4 address.
The instinct for a job that runs once a day and finishes in under a second is that a server is overkill and something serverless is the modern answer. I would argue the opposite, for two reasons that have nothing to do with compute.
The first is that this machine is not running one thing. It runs the site, a separate demo application, a Postgres database and this job. The cost is amortised across all of them, and the marginal cost of adding the fourth was nothing. A per-invocation platform prices each piece separately and the sum is not obviously smaller.
The second is the one that decided it. A rented server has a bounded, knowable monthly cost that does not move when something goes wrong. That property is worth a great deal when the thing you are deploying is unattended and you are one person.
There is a real cost on the other side and it should be said plainly: it is now my operating system. Security updates, disk, backups, certificates. That is a standing obligation a managed platform would have absorbed.
Bare Docker on a box means writing systemd units, wiring a reverse proxy, and doing certificates by hand. Kubernetes for four containers is a hobby rather than an architecture.
What sits in between is a self-hosted control plane. This one is Coolify: it watches a git branch, builds the Dockerfile, runs the container, manages the reverse proxy and issues certificates. Push to the tracked branch and a deploy happens. That is most of what a small platform-as-a-service does, on hardware you own, and it is the piece that makes the rest of this tractable.
The important consequence is not convenience. It is that infrastructure becomes configuration attached to the application rather than state living on a machine. The schedule, the volume and the environment all belong to the app record, so a server rebuilt from scratch brings them back. Anything I do by hand over SSH does not come back, and that distinction turned out to decide the fourth piece.
A three-stage build: install dependencies, build, then copy only the traced runtime output into a clean image. The application is a Next.js site emitting a standalone server.
Two lines in that Dockerfile are load-bearing in a way that is invisible when they are right.
COPY --from=builder /app/public ./public
COPY --from=builder /app/.next/static ./.next/static
The standalone server does not serve those two directories by itself. Omit them and the site boots, answers every request with a 200, and renders as unstyled HTML with no images. It reads exactly like a CSS bug, so you go looking in the stylesheet, and the fault is in the packaging.
The other is the bind address. Without it the server listens on loopback inside the container and the proxy gets a connection refused, from a container whose health check reports perfectly healthy.
ENV HOSTNAME=0.0.0.0Both belong to a family this article keeps returning to: the system is wrong, nothing is red, and the symptom points somewhere else.
The job writes files. A container's filesystem is discarded on redeploy, so those files need to outlive it. There are two ways to do that and they are not interchangeable.
The obvious one is a bind mount: pick a directory on the host, mount it into the container, done. I set that up first. It would not have worked, and it would not have told me.
Docker creates a missing host path as root. The container runs as an unprivileged user, uid 1001, because a web server has no business being root. So the job would have started, tried to write, failed on permissions, and the page would have carried on serving a copy compiled into the image, printing the date that image was built. Nothing would have crashed.
A named volume behaves differently in exactly the way that matters: it takes its initial ownership and contents from the image path it covers. So create the directory in the Dockerfile, owned by the user that will write to it, and the volume arrives writable.
RUN mkdir -p /data/disclosure && chown -R nextjs:nodejs /data
USER nextjs
A bind mount inherits nothing. A named volume inherits ownership from the image. That single sentence is the difference between a pipeline that runs and a page that quietly stops being true.
The reflex is cron on the host. I built that first too: an installer, a root crontab, a directory under /opt.
It works, and it costs three things. It needs an SSH session to install, so it is a manual step that has to be repeated and remembered. It writes as root into a directory the container reads as another user, which is the permissions problem again. And it lives on the machine rather than in the repository, so a rebuilt server loses it silently and the only symptom is a date that stops moving.
The control plane can run a scheduled command inside the application container instead. That removes all three. The schedule becomes configuration that deploys with the app, the command runs as the same user that reads the files, and the script ships in the image like any other source file.
name       museum-data-recount
command    node /app/scripts/museum-data.mjs --out /data/disclosure
frequency  17 4 * * *
Two details. The schedule reads in the server's timezone, which is UTC here, so 04:17 is 06:17 where I live; that is the sort of thing worth checking rather than assuming, because a job that runs two hours from when you think it does is a job you will misdiagnose later. And 17 minutes past rather than on the hour, because every unimaginative cron on the internet fires at :00.
The price of running in the container is that the container has no Python, so a Python script had to become a JavaScript one. That turned out to be the most instructive part of the whole exercise, and it is the third trap below.
Every failure I hit building this produced a working-looking page with a frozen date. That is the actual difference between a demo and a running system, and it is why the list below is the part I would take to another project.
Covered above, and it is first because it is the one I would otherwise have shipped. A bind mount to a path that does not exist yet: root-owned directory, unprivileged writer, silent failure, stale page.
Environment variables on this control plane can optionally be passed to the image build as well as to the running container. The second part writes their values into image layer metadata, where anybody who can read the image can read them.
I created a variable through the API. Then I opened it in the interface, and the build-time flag was on. It is on by default, and the API has no field for it: not in the published schema, not settable, and it reads back as null.
So a variable created programmatically is one whose exposure cannot be inspected programmatically. Here the value was a filesystem path and the exposure is worthless to anyone. The habit is not: the same mechanism had already put real API keys into image metadata on another application, and nobody caught it for weeks, because the application works perfectly either way.
An endpoint refusing a parameter tells you nothing about which way the flag was left. Check the artifact, not the interface to the artifact.
Moving the job into the container meant porting it from Python to JavaScript. A port is the most dangerous kind of change, because the output is supposed to be identical and nobody checks that it is.
So I ran both against the same input file and compared every field of the output. Three real bugs, none of which would ever have surfaced as an error.
The sharpest was a tie-break. To find the largest model in a year you reduce over the list, keeping whichever is bigger:
// returns b when the two are equal
reduce((a, b) => (size(a) > size(b) ? a : b))
When two entries are exactly the same size that comparison is false, so it quietly returns the second. Python's max returns the first. Three pairs in this dataset are tied to the parameter, and one of them is a model sold as a hosted service against the same model with its weights published, so the bug decided whether a headline figure named an open model or a closed one.
The fix is not to write the comparison more carefully. It is to stop having an implicit rule:
After fixing that and two smaller ones, the record-level output matched at 1,065 rows with zero differences. The aggregates differed only in the two places the new rule exists to decide.
A port is not verified by reading it. Run both against the same input and diff the output, or you have moved code rather than behaviour.
Three silent failure modes is a pattern, and the pattern has an obvious consequence: I cannot rely on noticing. So the application reports which data it is serving.
There are two possible sources. A snapshot committed to the repository and compiled into the build, which is always present, and the one the scheduled job writes to the volume. The reader prefers the volume when it is valid and newer, and falls back otherwise. Then it says which one won, in plain text at the foot of the page.
This reading was taken after the current build was deployed.

                        or

This reading is the one compiled into the current build.
The second sentence is the alarm. It is not an error, because nothing is broken: the page is correct, dated and honest. It means the pipeline is not reaching the page, and the cause is one of the three traps above. One sentence, on the page itself, no dashboard and no alerting.
The job also refuses rather than guessing. It validates before it writes, so a truncated download, a renamed column or a file that is not the dataset leaves the previous snapshot untouched and exits non-zero. That trade is deliberate and it is worth stating in the direction that sounds worse: this system prefers to be stale. A page showing last week's figure with last week's date beside it is honest and slightly old. A page showing a number derived from half a file looks exactly like a correct one.
Both guards were tested by breaking things on purpose, because a guard nobody has watched fail is not a guard, it is an intention.
wall time      0.45 s   (0.08 s of CPU)
download       2.14 MB per run, 64 MB per month
disk growth    28 KB per day, 10 MB per year
traffic        0.0003% of the server's monthly allowance
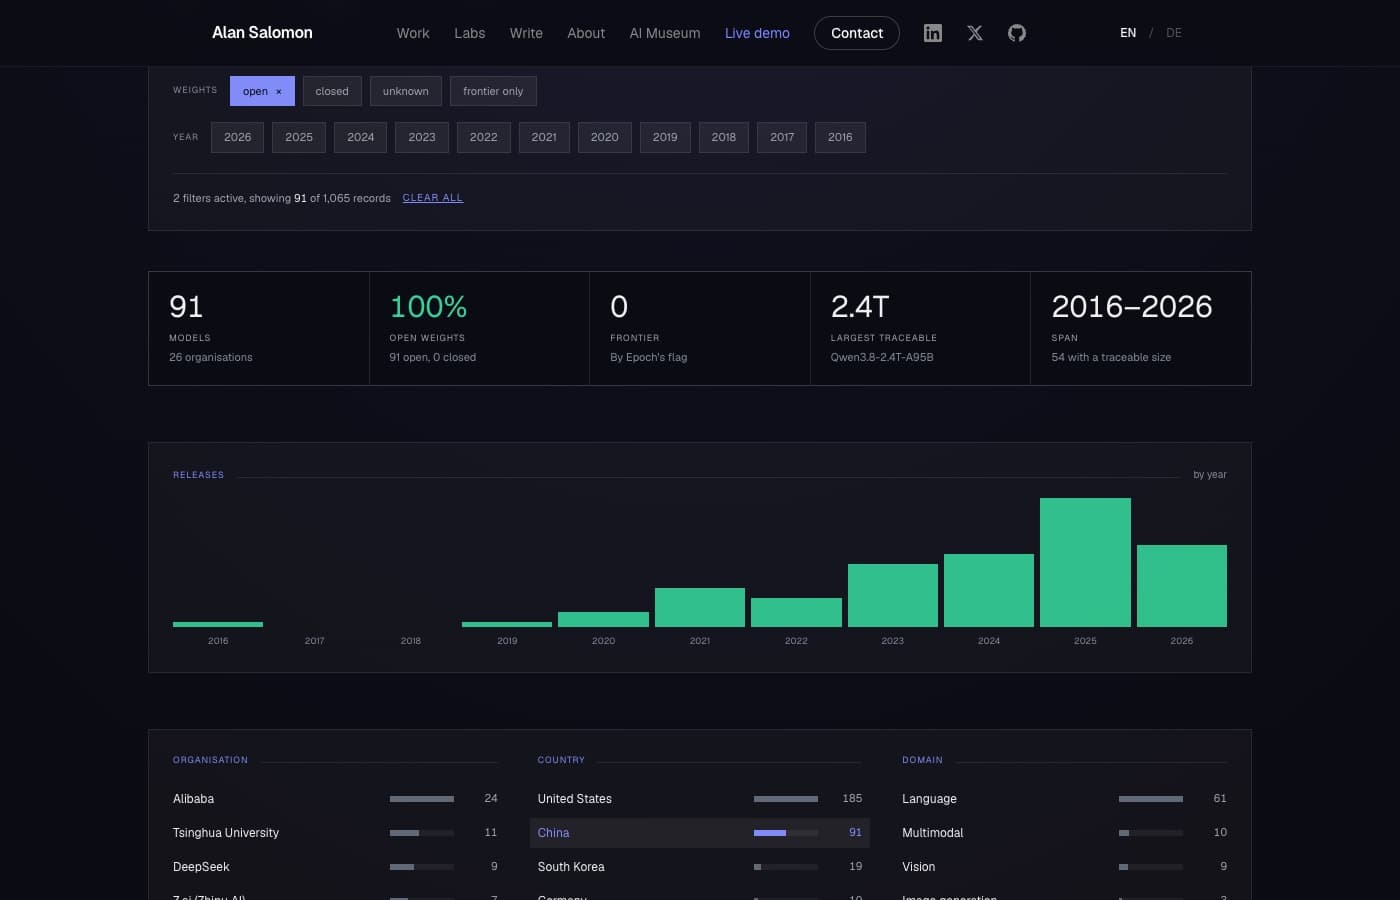
A decade of daily snapshots is 0.10 GB on an 80 GB disk. There is no API key, no model call and no third-party dependency: the whole pipeline is one file using the standard library, reading one public CSV.
I am including these because the belief that running things is expensive is one of the reasons so much work stops at the demo. It is not expensive. The server costs ten euros a month and does four jobs. The marginal cost of this one is the electricity.
This is one small pipeline over one public dataset, and several things about it are easy because of that.
There is no authentication anywhere, so there are no credentials to rotate. There is one source, so nothing has to be reconciled against a system that disagrees. The data is small enough to recompute from scratch every run, which removes incremental loading, watermarks, late-arriving rows and every class of bug that lives in them. If your pipeline has any of those properties, the shape here does not transfer unchanged.
The cost figures are this workload on this machine. 2.14 MB a day is a rounding error because the source is one modest CSV, and the same architecture over a source that ships gigabytes is a different conversation about a different bill.
And there is no uptime figure, deliberately. At the time of writing this has run successfully once on demand and has not yet completed a single unattended night. Publishing an availability number with no history behind it would be exactly the kind of claim this whole system is built to avoid making. The date on the page will answer that question better than I can here, which is rather the point of putting it there.
Ask of anything you run on a schedule: if this stopped working tonight, what would be different in the morning?
If the honest answer is nothing visible, you do not have a running system. You have a demo with a timer attached, and the only difference between the two is how long it takes to find out.
The dashboard this describes is at AI Analytics, the measurement behind one of its figures is at Who still tells you how big their model is, and what is automated and what is not is documented at How this museum is made. The date at the top of each is the part to check.